Software
![]()
![]()
Software
DDT is freely available to users at HPC2N.
DDT (Arm Forge DDT) - the Distributed Debugging Tool - is an advanced debugging tool available for scalar, multi-threaded and large-scale parallel applications.
DDT - the Distributed Debugging Tool - is a commercial debugger originally produced by Allinea Software. It is primarily for debugging parallel MPI or OpenMP programs, including those running on Linux clusters. It can also be used for scalar code in C, C++, and Fortran 90.
It can be used to find bugs in programs on both small and large clusters - from 1 to 1000s of processors. The debugger has logarithmic performance for most collective debugging operations, due to using a tree architecture across the machine network to control the many single-process debuggers.
It also features a memory debugging tool, which can be used to detect memory leaks. Aside from this, it is able to debug GPU software for CUDA applications.
On HPC2N we have Forge DDT available as a module.
To use the Forge DDT module, add it to your environment. Use:
module spider forge
to see which versions are available and how to load the module.
ml Forge/18.2.1-Ubuntu-16.04-x86_64
You can read more about loading modules on our Accessing software with Lmod page and our Using modules (Lmod) page.
Loading the module should set any needed environmental variables as well as the path.
Since DDT has a GUI (Graphical User Interface), it is best used through our ThinLinc setup.
If that is not a viable option then you need to enable trusted X11 forwarding. On Linux systems, this is done like this (connecting to HPC2N's Kebnekaise system):
$ ssh -Y username@kebnekaise.hpc2n.umu.se
You can read more about how to use X11 forwarding on other OS's here. There is also a section about X Forwarding in the DDT manual (section 3.12).
You need to load any compilers you will use, as well as DDT itself. In this example, I use the compiler toolchain foss/2017a (GCC compilers, OpenMPI, various libraries). Use module avail to see the possible compiler toolchains. I use Forge DDT version 18.2.1.
$ ml Forge/18.2.1-Ubuntu-16.04-x86_64
$ ml foss/2017a
You need to compile your program with the debugging flags enabled (and preferrably with optimization turned off, as that can confuse the results). For a Fortran 90 MPI program, compiled with GCC compilers, this is done like this:
$ mpif90 -g -O0 my_mpi_program.f90 -o my_mpi_program
For a C OpenMP program, compiled with GCC compilers, this is done like this:
$ gcc -g -O0 -fopenmp my_program.c -o my_program
For other debugging flags, or for different compilers, read the Compiler flag page.
There are several possible ways to run ddt.
We are going to look at two of the options; where you debug a core file, and where you debug a program running from DDT.
Debug a core file (4. in the list above)
DDT allows you to open one or more core files that have been generated by your application.
If you wish to debug using core files, click the 'Open Core Files' button on the Welcome Screen
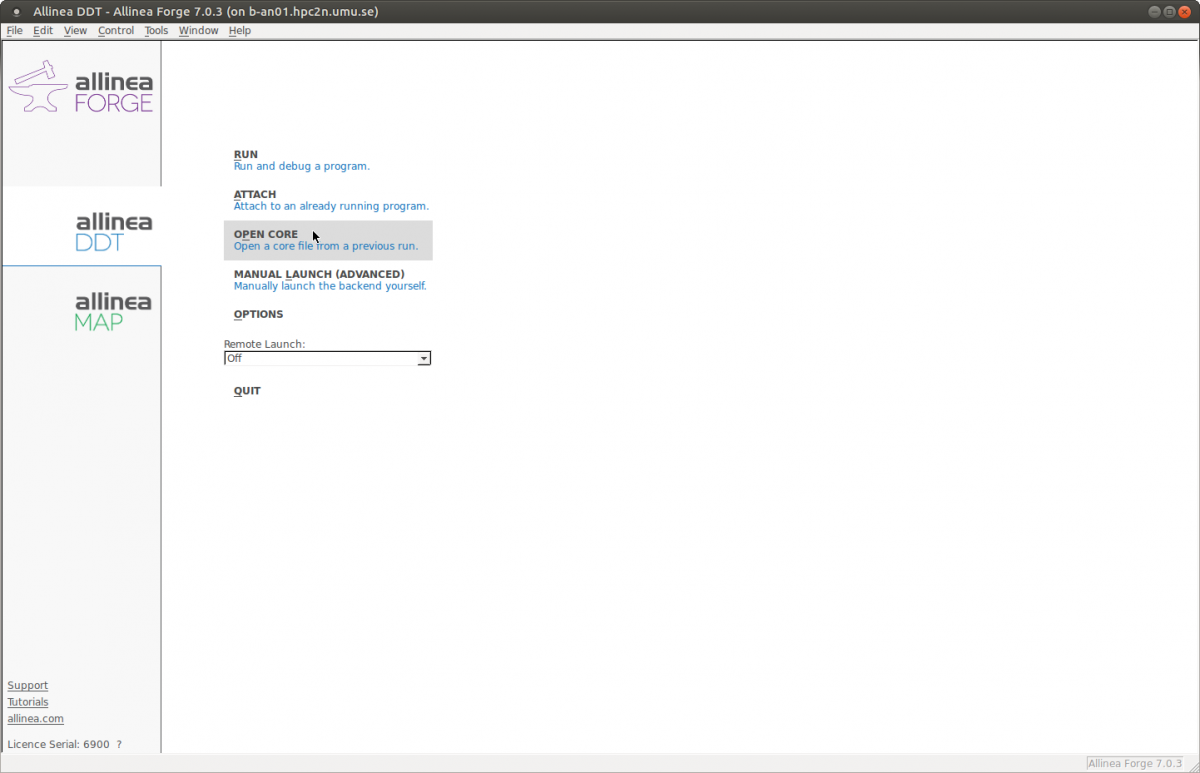
This will open the 'Open Core Files' window, which allows you to select an executable and a set of core files. Click 'Ok' to open the core file(s) and start debugging it/them.
Note that while DDT is in this mode, you cannot play, pause, or step into anything, because there is no process active. You will be able to evaluate expressions and browse the variables and stack frames saved in the core files, though.
Clicking the 'End Session' menu option will return DDT to its normal mode of operation.
Debug a program running from DDT (1. and 5. in the list above)
There are two ways of doing this;
The latter is recommended, to avoid errors, so this is what we will do in this example.
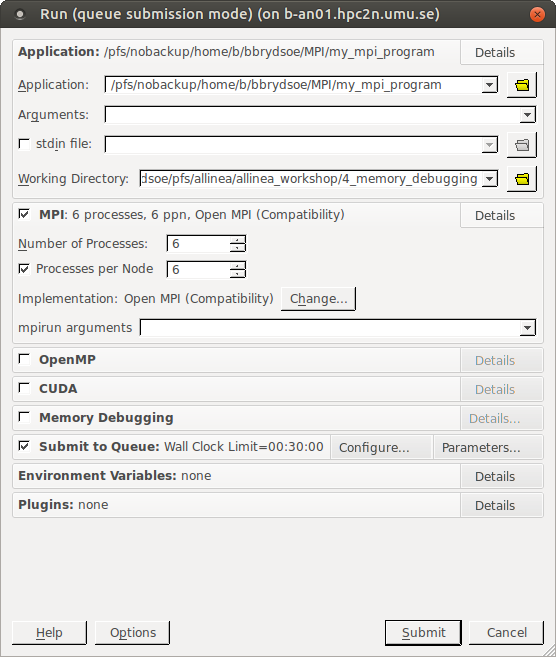
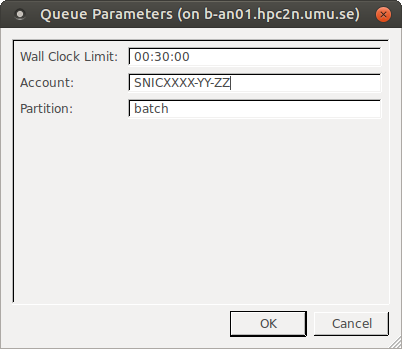
This example shows how to prepare to debug for a MPI program, but it is easy to adapt to serial programs. For those, no queue is needed, and you will not be choosing number of nodes, etc. For MPI programs, you DO need to enter job queue, etc. and wait for your job to run.
We will assume you have your program compiled with debugging flags, as described above.
Now you have to wait for your job to start running. While you wait, DDT will show squeue output. You can scroll down and find your job id, and use that to run scontrol show job <jobid> on it in an xterm window.
$ scontrol show job <job id>
This will give an estimate of when your job will start to run.
The actual debugging process
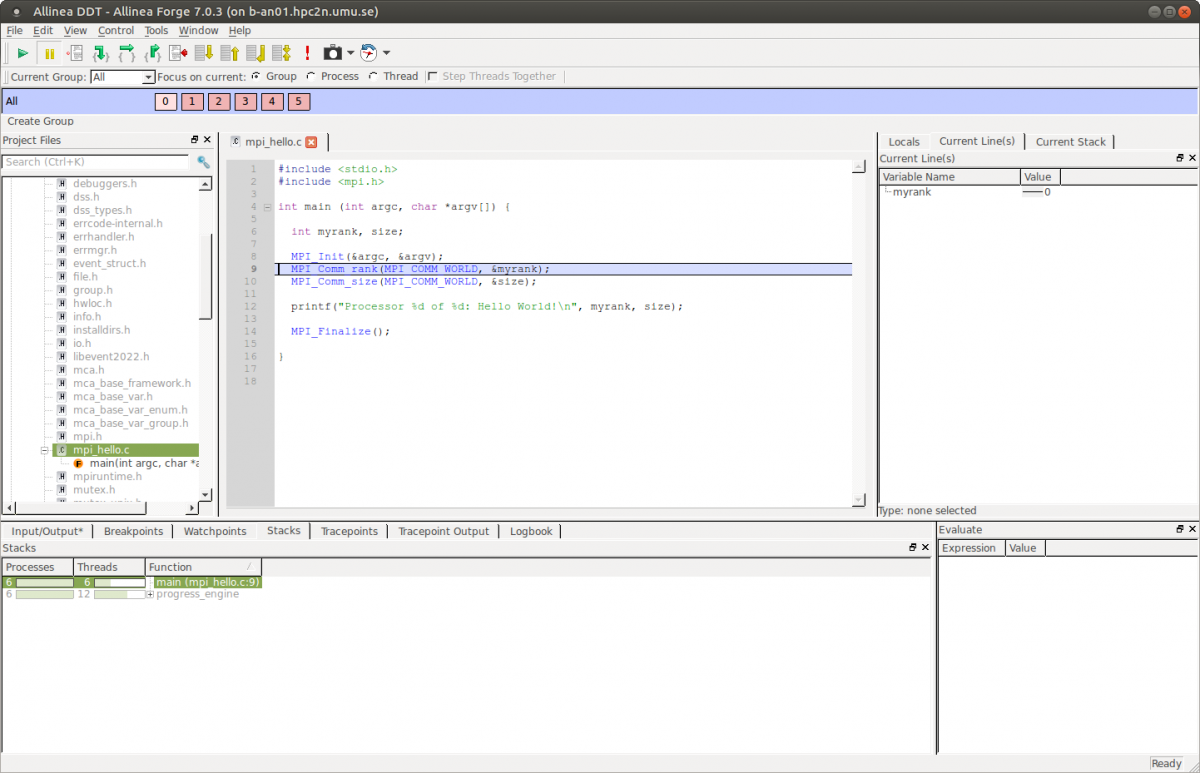
DDT uses a tabbed-document interface. This allows you to have many source files open, and to view one of them. Each component of DDT is a dockable window, which may be dragged around. The components can also be hidden or shown. This shows the default DDT layout (click to enlarge).
As soon as DDT starts a session, it will find source and header files in the executable, which will be reconciled with any files present on the front end server and displayed in a tree view (left) in the 'Project Files' tab in the 'Project Navigator' window. You can load a souce file for viewing by clicking on the file name.
When a selected process is stopped, the 'Source Code Viewer' (middle of the layout) jumps to the correct file and line, if the source is available. If some souce files have been moved or otherwise are missing, they can be found by adding extra directories (right-click while in the 'Project Files' tab and select 'Add/view source directory(s)').
Below we will look at some of the many features of DDT. For information about using other featurs of the program, see the DDT manual.
Find File, Function, or variable
You can type the name of a file or a function into the box above the source file tree, in order to search for it. There is also a 'Find' option in the 'Search' window, which can be used to find occurences of an expression or variable in the currently visible source file. Just type in the function you are looking for.
Jump to line/jump to function
There is a jump to line (Ctrl-L) function in DDT, which can be used to directly to a line of code. It can be found in the 'Search' menu.
You can also jump directly to the implementation of a function. In the 'Project Files' tab in the left side, there is a small '+' symbol next to many of the files. Clicking that will open a list of the functions for that file, and clicking a function will display it in the central Source Code viewer.
Controlling Program Execution
There are only few differences between debugging a multi-process and a single-process code. One of the differences is that in the first case, you have to use 'Process Groups'.
DDT allows you to group the processes so that you can perform action on more than one process at a time. Use the 'Process Group Viewer' to quickly see the status of processes. It is located at the top of the screen (the blue row in the screen-shot above). Above that row you can pick "Group", "Process", "Thread"... A new row will open under the row for all the processes when you click "Process". IN the new row you can look at any threads that process has. In general, each row relates to a group of processes, and operations (play, pause, step...) can be performed on the currently high-lighted group. You switch between the groups by clicking on them, and groups can be created, deleted, and modified (except the 'all' group).
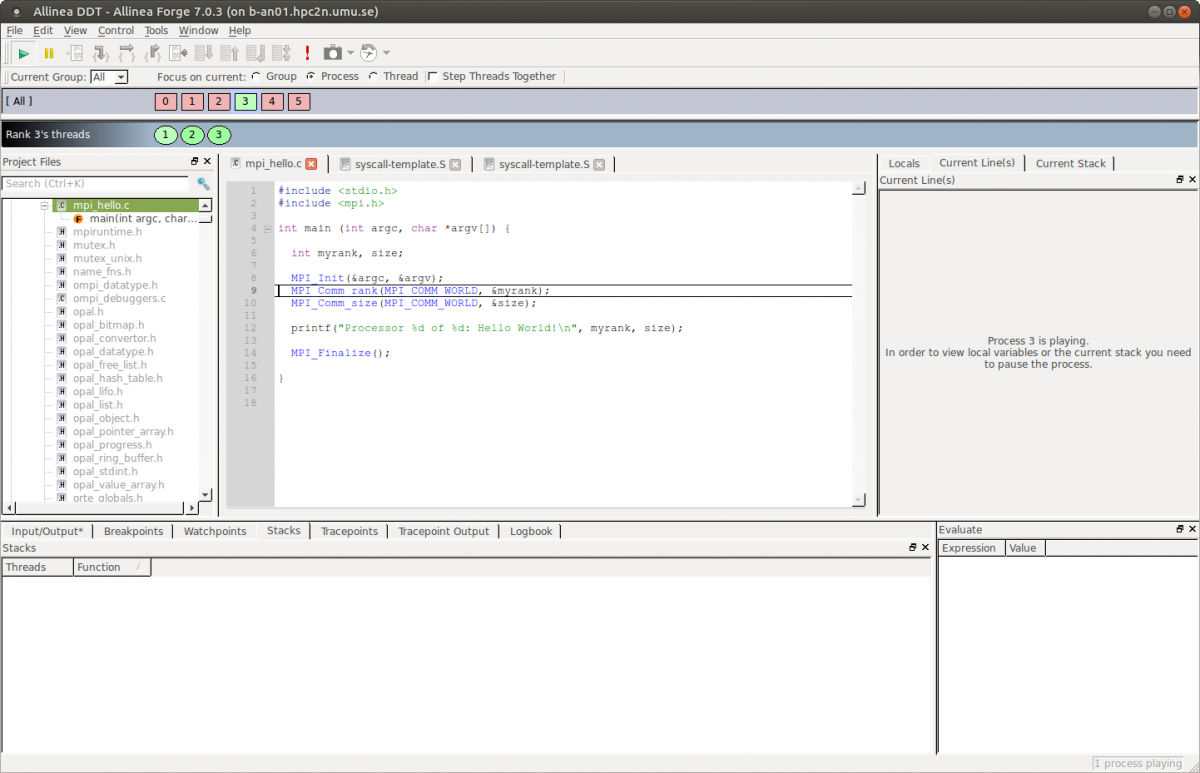
In the default/detailed view, each processes is represented by a square, containing its MPIP rank. Red are paused processes, green are playing processes, and grey are finished processses.
When a single process is selected, the local variables are displayed in the 'Variable Viewer', and the displayed expressions are evaluated. By double-clicking a process, you can make the 'Source Code Viewer' jump to the file and line in the current stack frame.
In order to copy processes from one group to another, just click and drag the processes. To delete a process, press the delete key when it is selected. You can hold down Ctrl to select more than one process.
Focus Control
This is used for focusing on either individual processes or threads, or process groups. When focused on a particular process, etc. actions (stepping, playing, pausing, adding breakpoints...) only applies to that process, rather than the whole group.
Breakpoints
The breakpoints tab in DDT will be filtered to only display breakpoints relevant to the currently selected group. When focused on a process, the breakpoint tab will display which thread the breakpoint belongs to. If focused on a group, the tab displays both the process and the thread the breakpoint belongs to.
Breakpoints can either be set by clicking the breakpoint button (third from left in the row of symbols near the top) or by clicking "Control" in the top menu and then choosing "Add Breakpoint".
Code Viewer
The code viewer in DDT shows a stack back trace of where each thread is in the call stack. It is filtered by the currently focused item, i.e. if you have focused on a specific process, you will only see the back trace of that process.
Playing and Stepping
Playing, stepping, and using 'Run to here' (symbols along the top or under menu point "Control") is affected by the currently focused item. Only the process or process group chosen will be executed.
When focus is on a process, you can use the feature 'Step Threads Together'. This means DDT will try to synchronize the threads when performing actions like stepping, pausing, 'Run to here'...etc. If, say, you choose 'Step threads together' DDT will attempt to play both threads to the specified line before pausing the program.
Note You should always use 'Step threads together' and 'Run to here' to enter or move within OpenMP parallel regions.
Stepping Through A Program
To continue the program playing, click 'Play/Continue'. Pause it by clicking 'Pause'. If your program is multi-process, this will stop/start all processes in the current group.
There are three types of stepping
Note if you are using 'Step Out' you must be careful not to try and step out of the main function, as this will end the program. You will then need to restart and wait for your job to run again.
Setting Breakpoints
Conditional Breakpoints
Select the breakpoints tab to view the breakpoints in your program. You may add a condition to any of them by clicking on the condition cell in the breakpoint table and entering an expression that evaluated to true or false. Each time a process passes the breakpoint, the expression will be evaluated.
Breakpoints can be deleted by right-clicking on them or by right-clicking at the file/line with the breakpoint whilst in the correct process group. Then select delete breakpoint.
There are a number of default breakpoints (exit, abort/fatal MPI error, throw, exceptions, fork, exec call...). You can disable/enable these using the 'Control' -> 'Default Breakpoint' menu.
Setting Watchpoints and Tracepoints
Watchpoints will cause DDT to stop every time the variable or expression changes. You set them by right-clicking on the 'Watchpoints View' and selecting the 'Add Watchpoint' - or by dragging a variable from the 'Local Variables' to the 'Watchpoints View'.
Tracepoints allow you to see what lines of code your program is executing without stopping the execution. Every time a thread reaches a Tracepoint, it will print the file and line number to the Input/Output view.
You add Tracepoints by right-clicking on a line in the 'Source Code Viewer' and selecting 'Add Tracepoint', or by right-clicking in the 'Tracepoints' view and selecting 'Add Tracepoint'.
Examining the Stack Frame
The Stack back trace for the current process is displayed under the 'Stack' tab of the 'Variables' window. When you select a Stack frame, DDT will jump to that position in the code, and it will display the local variable of that frame.
The Parallel Stack View shows a tree of functions, merged from every process in the group. If there's only one branch in this tree – one list of functions – then all your processes are at the same place. If there are several different branches, then your group has split up and is in different parts of the code!
Variables And Data
The 'Variables Window' contains two tabs which provide different ways to list your variables. The 'Locals' tab contains all the variables for the current stack frame (local variables for the current process's currently active thread and stack frame), while the 'Current Line(s)' tab displays all the variables referenced on the selected lines.
Right-clicking in these windows brings up additional options, including the ability to edit values, change the display base, or compare data across processes and threads.
Viewing Array Data
Fortran users may find that it is impossible to view the upper bounds of an array. This is due to a lack of information from the compiler. This will cause DDT to display an array with a size of 0 or <unknown bounds>. It is still possible to view the contents of the array using the 'Evaluate' window to view the separate arrays.
There are more about viewing array data in chapter 6 of the DDT manual.
There are some information to be found on the Forge DDT homepage.
Forge also has a downloadable user guide.